Explain the chart! Getting to school and pocket money
A teaching resource designed to energise your English lessons.
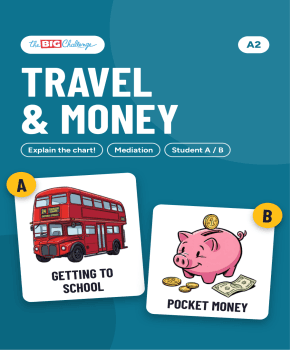
Mediation pair work with charts, in two rounds. In each round, one pupil has a bar chart from a school survey (how pupils get to school, then how much pocket money they get) and explains it; the partner, who cannot see it, draws the bars on an empty chart and answers two questions. If the bars match, the explanation was clear. Practises The most popular is ..., more ... than ..., only a few, about half and the biggest / the smallest, with numbers to 100. 3 pages: Student A, Student B, teacher page with the answer key. About 25 minutes.
Documents to download (1)
- Pair work: Student A, Student B, key In your teacher account
Teaching guide
Objective & content
A mediation pair activity with charts, in two rounds. In round 1, Student A has a bar chart from a school survey, "How do you get to school?" (200 pupils: walk, bus, car, bike, train), and Student B, who is writing a short article for the school newspaper, draws the bars on an empty chart and answers two questions. In round 2, Student B has a bar chart, "How much pocket money do you get a week?", and Student A, who is helping to plan a class trip, draws it and answers. The pupil with the chart must not show it: they say the numbers and what they mean. By the end, pupils can explain simple figures clearly and compare them: the most popular, more than, only a few, about half.
Pedagogical guide
Mediation means passing on information to someone who hasn't seen it. Here the information is numbers, and the check is built in: if the partner's bars match the chart, the explanation was clear; if not, the pair finds where it went wrong. Each page has the rule ("Don't show your chart. Tell your partner the numbers and what they mean."), a box of phrases (The most popular is ..., ... pupils go by ..., More pupils ... than ..., Only a few ..., About half / a quarter ..., That's the biggest / the smallest.) and questions to help the pupil who asks. The language is the present simple, comparatives and superlatives, How many ...? and numbers to 100. The surveys are from an invented school, and each question has one answer. Page 3 is the teacher page: the idea, four steps, the language and the key.
Suggested procedure
One activity of about 25 minutes.
- (3 min) Set up the pairs: copy page 1 (Student A) for half the class and page 2 (Student B) for the other half, and put pupils in A + B pairs, face to face. Nobody shows their chart. Read the rule and the phrases box with the class.
- (8 min) Round 1: A explains the getting-to-school chart; B draws the bars and answers the two questions.
- (8 min) Round 2: B explains the pocket money chart; A draws the bars and answers.
- (6 min) Pairs put the charts side by side and check, then tell the class one thing that surprised them: "I was surprised that ...". Check with the key on page 3.
Adaptations
[S] The pupil who explains says each number twice, and the partner repeats it back before drawing.
[A] The class does the same survey, and two pupils explain the class results to another class.
Materials & prerequisites
Print infogap.pdf: page 1 for Student A and page 2 for Student B, one copy per pupil; page 3 is the teacher page. Pupils need a pencil, and a ruler helps. They should already know numbers to 100 and comparatives. It goes well with work on school life, transport or money, and with the "Explain it to me!" sheets.
Possible adaptations
- Lower levels: Offer segmented listening and additional visual aids.
- Advanced levels: Encourage an oral summary and a debate in English on the theme.
- Large groups: Organise group work with differentiated roles.
🔒 Restricted content
This resource requires a subscription to be viewed.
Unlock the resourceIncluded in the subscription